Grafana is The open platform for beautiful analytics and monitoring.
Here we installing grafana , then in other post we try to use with zabbix server to have a nice graph an report:
#sudo yum install wget

#wget https://s3-us-west-2.amazonaws.com/grafana-releases/release/grafana-5.3.1-1.x86_64.rpm
#sudo yum localinstall grafana-5.3.1-1.x86_64.rpm

#sudo systemctl daemon-reload

#sudo systemctl start grafana-server

#sudo systemctl status grafana-server

#sudo systemctl enable grafana-server
Installing Zabbix Plugin:
#sudo grafana-cli plugins install alexanderzobnin-zabbix-app

#sudo systemctl restart grafana-server

#sudo firewall-cmd --permanent --add-port=3000/tcp

#sudo firewall-cmd --permanent --list-all
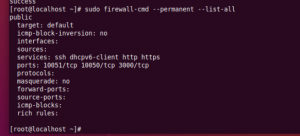
#sudo firewall-cmd --reload
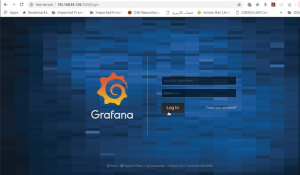 The default login credentials are
 admin/admin
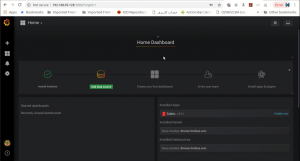
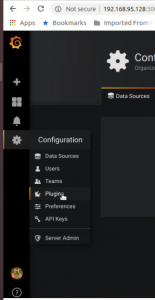
Go to Plugin:
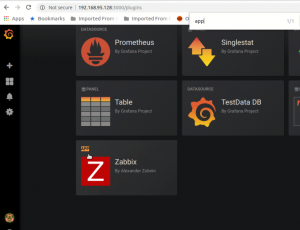
Select Zabbix app:
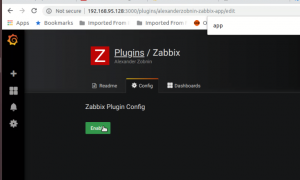
Press enable Button:
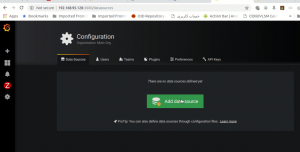
Add Datasource:
And , In this windows enter data as follows:
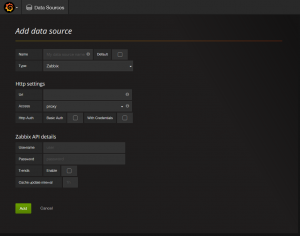
- Name field: Enter a name for this new data source
- Type : Zabbix
- Url field: http://your_zabbix_server_ip_address/zabbix/api_jsonrpc.php
- Fill in the Username and Password fields with the username and password for Zabbix. The default credentials are admin/zabbix
You can leave the other options at their default values.
Click the Add button to test and save the configuration. You’ll see a success message that looks like the following:

If you do not see this message, check your credentials and test again.
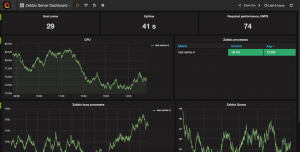
Select Zabbix server Dashboard from the dropdown list at the top of the screen